DNA is the biological way of storing information, the equivalent to a computer’s main disk. This post will try to focus on this side of DNA and how it can be visualized.
Unlike a computer’s main disk, DNA has not only two digits to store information (0 and 1), but four letters (G, A, T, C), which are given in four different colours below (red refers to G, yellow refers to A, blue refers to T and green refers to C). Since a DNA-molecule represents a linear sequence of these letters, it appears straight forward to represent such a sequence by using, e.g., subsequent cylindrical disks. Below this is done for a random sequence…

Random DNA sequence

Random DNA sequence
…and for a repetitive sequence. (Repetitive sequences are frequently observed in genomes. Amongst other things, they provide “handles” for managing the DNA. The sequence shown here (TTAGGG) is a typical element of human chromosomal ends (telomeres).
")
Repetitive sequence (human telomer)
The linear arrangement of the DNA-sequence appeared somewhat boring to me and I thought about ways to make it more interesting. Helical arrangements are an obvious choice. For a first try I applied 1 turn/ten building blocks like in the double helix.

Random DNA sequence

Random DNA sequence
But I prefer the result with a more elongated helix.

Random DNA sequence

Random DNA sequence
Now let us work on a real sequence. I have chosen a very basic one, the human beta globin gene. (This gene specifies the sequence of one protein component of the human red blood pigment hemoglobin, essential for the transport of oxygen in the blood.) In the following picture only information defining the globin protein is given in colour. For all other parts of the gene (introns, untranslated regions, promoter) the sequence is given in different shades of grey. Important signals for processing of the sequence information are labelled by lighter colours.
The following image shows the first two portions of the globin gene containing information ending up in the protein (part of exon 1 and exon 2). They are separated by intron 1. Borders between exons and introns and the ATG start within exon 1 are labelled by light colours.

Gene for beta-globin
Here follows an overview of the whole gene containing three different (coloured) regions defining the globin protein (exons) and a number of signals important for information processing (white).
![]()
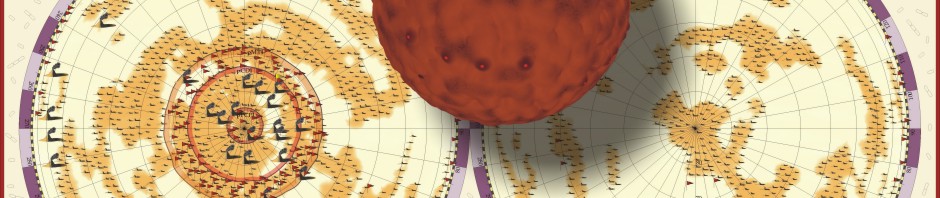
The problem with this approach for visualization (apart from being somewhat conventional) is the large size of genes. Accordingly many details are lost in a global view, while a detailed look inevitably looses the global perspective. One partial solution to this problem is to spread the gene over a larger portion of the image. Below, a spiral arrangement of the gene has been chosen (starting in the center). Elements important for information processing are now labelled in a light green, so C is labelled by a dark turquoise instead of a dark green.

Gene for beta-globin
Here is the same thing in another perspective, showing part of exon 3 in the foreground.

Gene for beta-globin